Basic information
Understanding protein corona composition is essential for evaluating their potential applications in biomedicine. Relative protein abundance (RPA), accounting for the total proteins in the corona, is an important parameter for description. We comprehensively predicted RPA using multiple machine-learning algorithms. An accurate prediction of whether a protein was adsorbed on the nanoparticles (i.e., whether the RPA is greater than 0), a dichotomous prediction, was realized using multiple machine learning algorithms. The advantages and disadvantages of the different machine learning algorithms were analyzed using Shapley Additive exPlanations-based interpretable analysis. We selected machine learning algorithms to build regression models to predict the specific value of the RPA based on the classification prediction experience. After interpretable analysis, we gained insights into the differences in the learning pattern differences of machine-learning algorithms on protein corona information data.
RPA Prediction
Choose a prediction task
This is the first step, you first have to choose the prediction task type. "Classification" stands for classification prediction, i.e., prediction of whether a protein is adsorbed on the nanoparticles (prediction of whether the RPA is greater than 0). "Regression" stands for regression prediction, i.e., prediction of the relative amount of a protein adsorbed on the protein corona (prediction of the specific value of the RPA of a protein).
Choose an individual protein
In the second step,Choosing an individual protein to predict its RPA value on a particular protein corona. For the classification task you can choose 178 proteins and for the regression task you can choose 129 proteins.
Enter protein corona information data
In the third step, you will enter some protein corona information data, including 8 qualitative and 13 quantitative factors. Use these as a feature to predict the RPA value of selected protein on the corresponding protein corona. You can either manually enter a piece of relevant information to submit, or you can upload a file with a (.csv) suffix to submit. The uploaded file must contain these 21 features. Before editing the file, you can download the example file by clicking on the “Download Example” button, fill in your own data according to the example file, and make sure the column names are correct. Before you are ready to submit, please make sure to click the “Check Format” button to check the format of the data you have entered or uploaded, only if the format is correct can you guarantee that the prediction results will be generated. Once the format is correct, you can click the “Submit” button to submit the data to get the corresponding prediction results.
Eight qualitative factors
Thirteen quantitative factors
In [] is the recommended range of values for each quantitative factor. SizeTEM is an abbreviation for "size measured by transmission electron microscopy". SizeDLS is an abbreviation for "size measured by dynamic light scattering". PDI is an abbreviation for "polydispersity index".
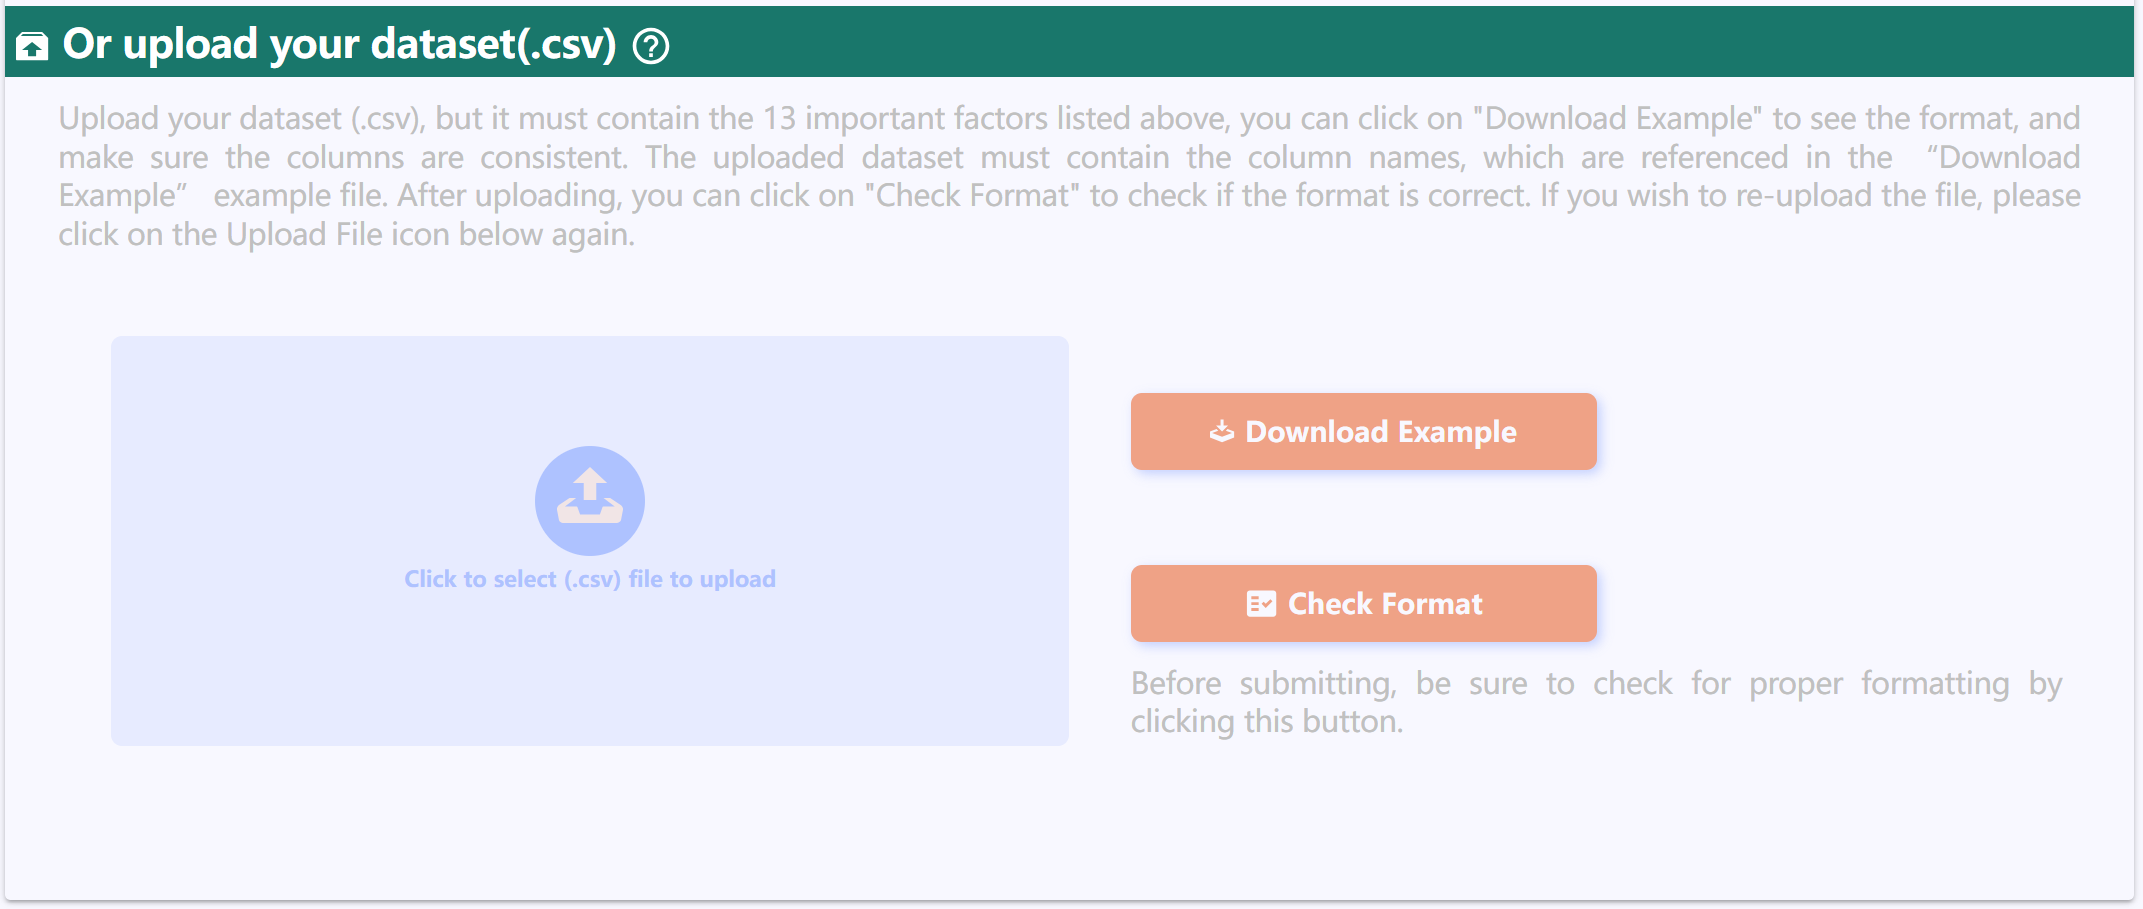
Or upload your dataset(.csv)
Upload your dataset (.csv), but it must contain the 13 important factors listed above, you can click on "Download Example" to see the format, and make sure the columns are consistent. The uploaded dataset must contain the column names, which are referenced in the “Download Example” example file. After uploading, you can click on "Check Format" to check if the format is correct. If you wish to re-upload the file, please click on the Upload File icon below again.
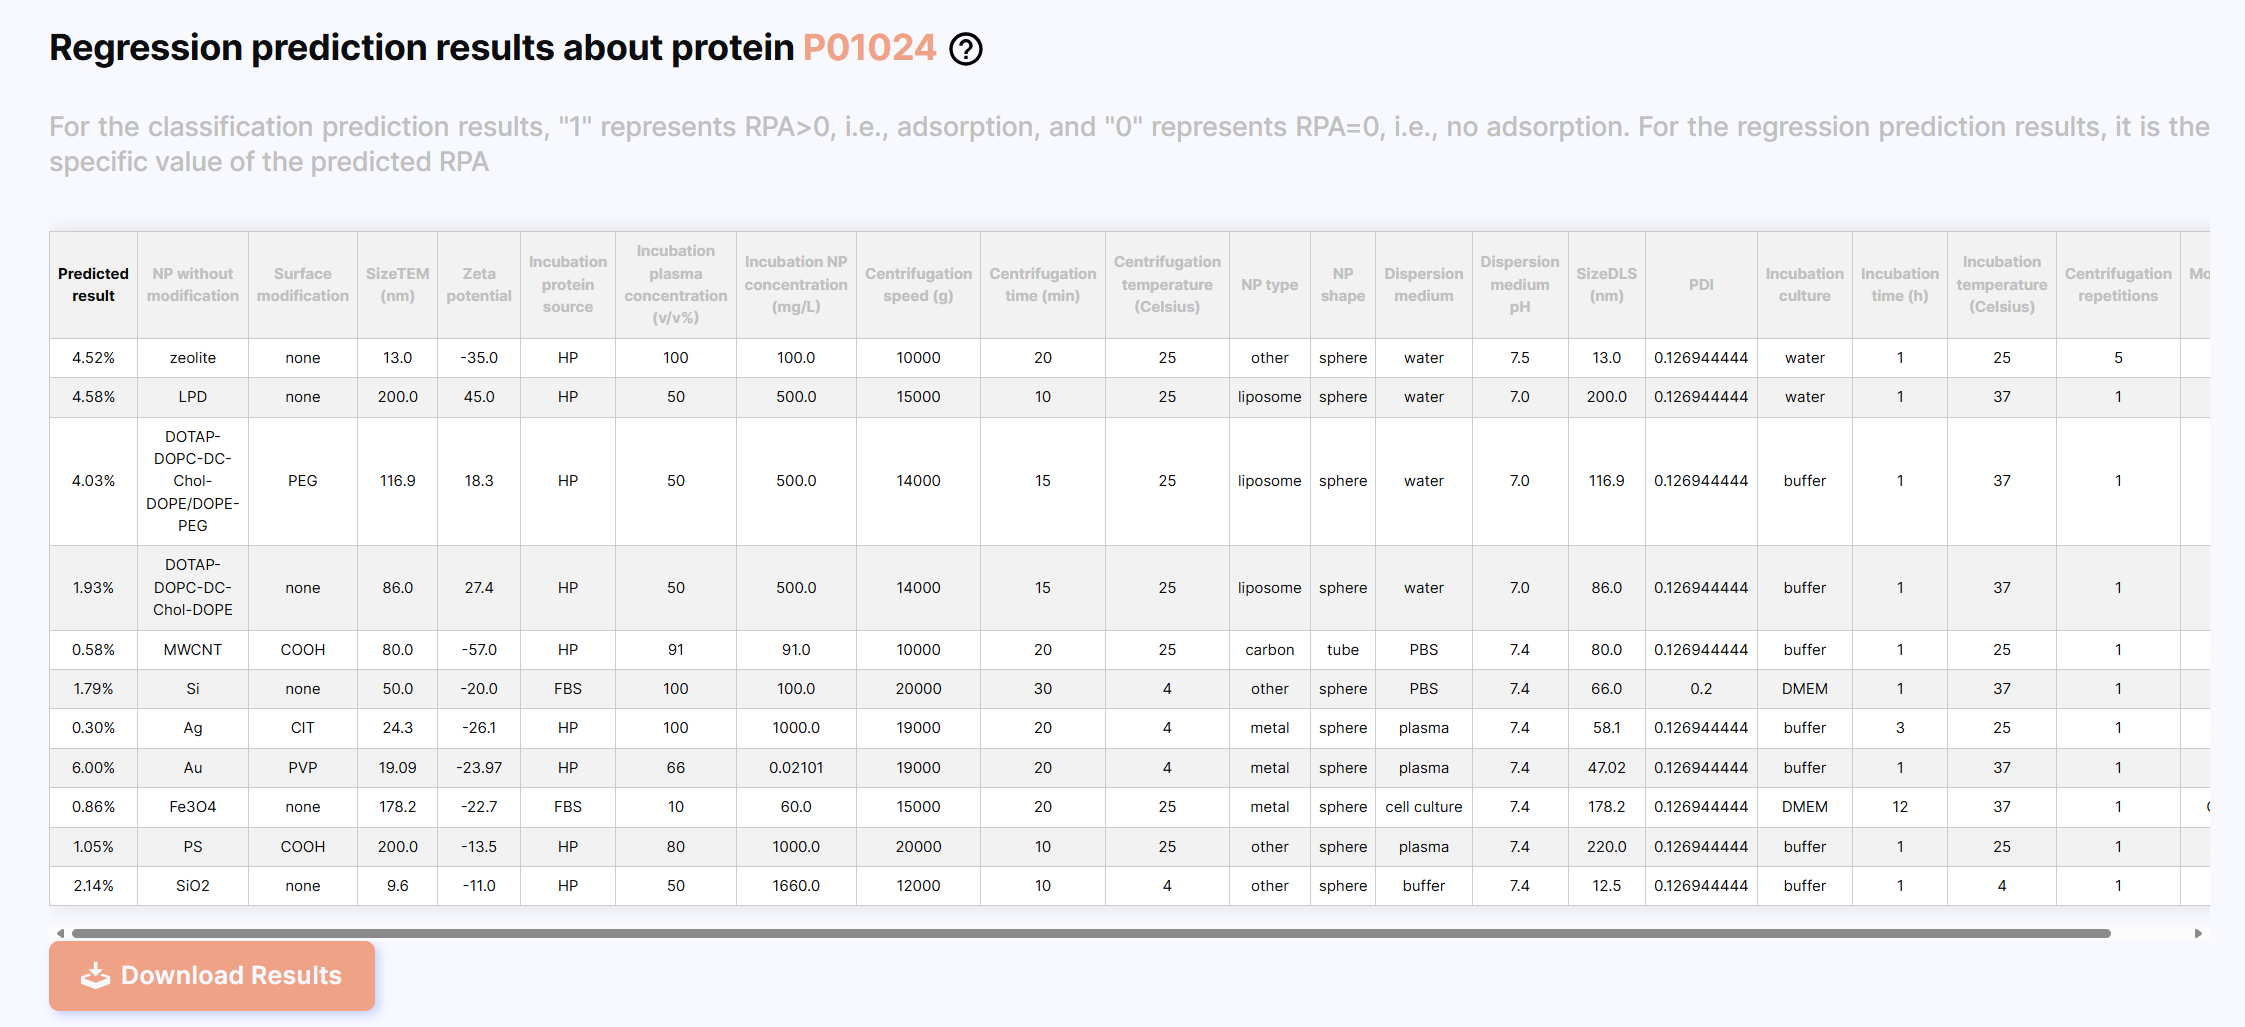
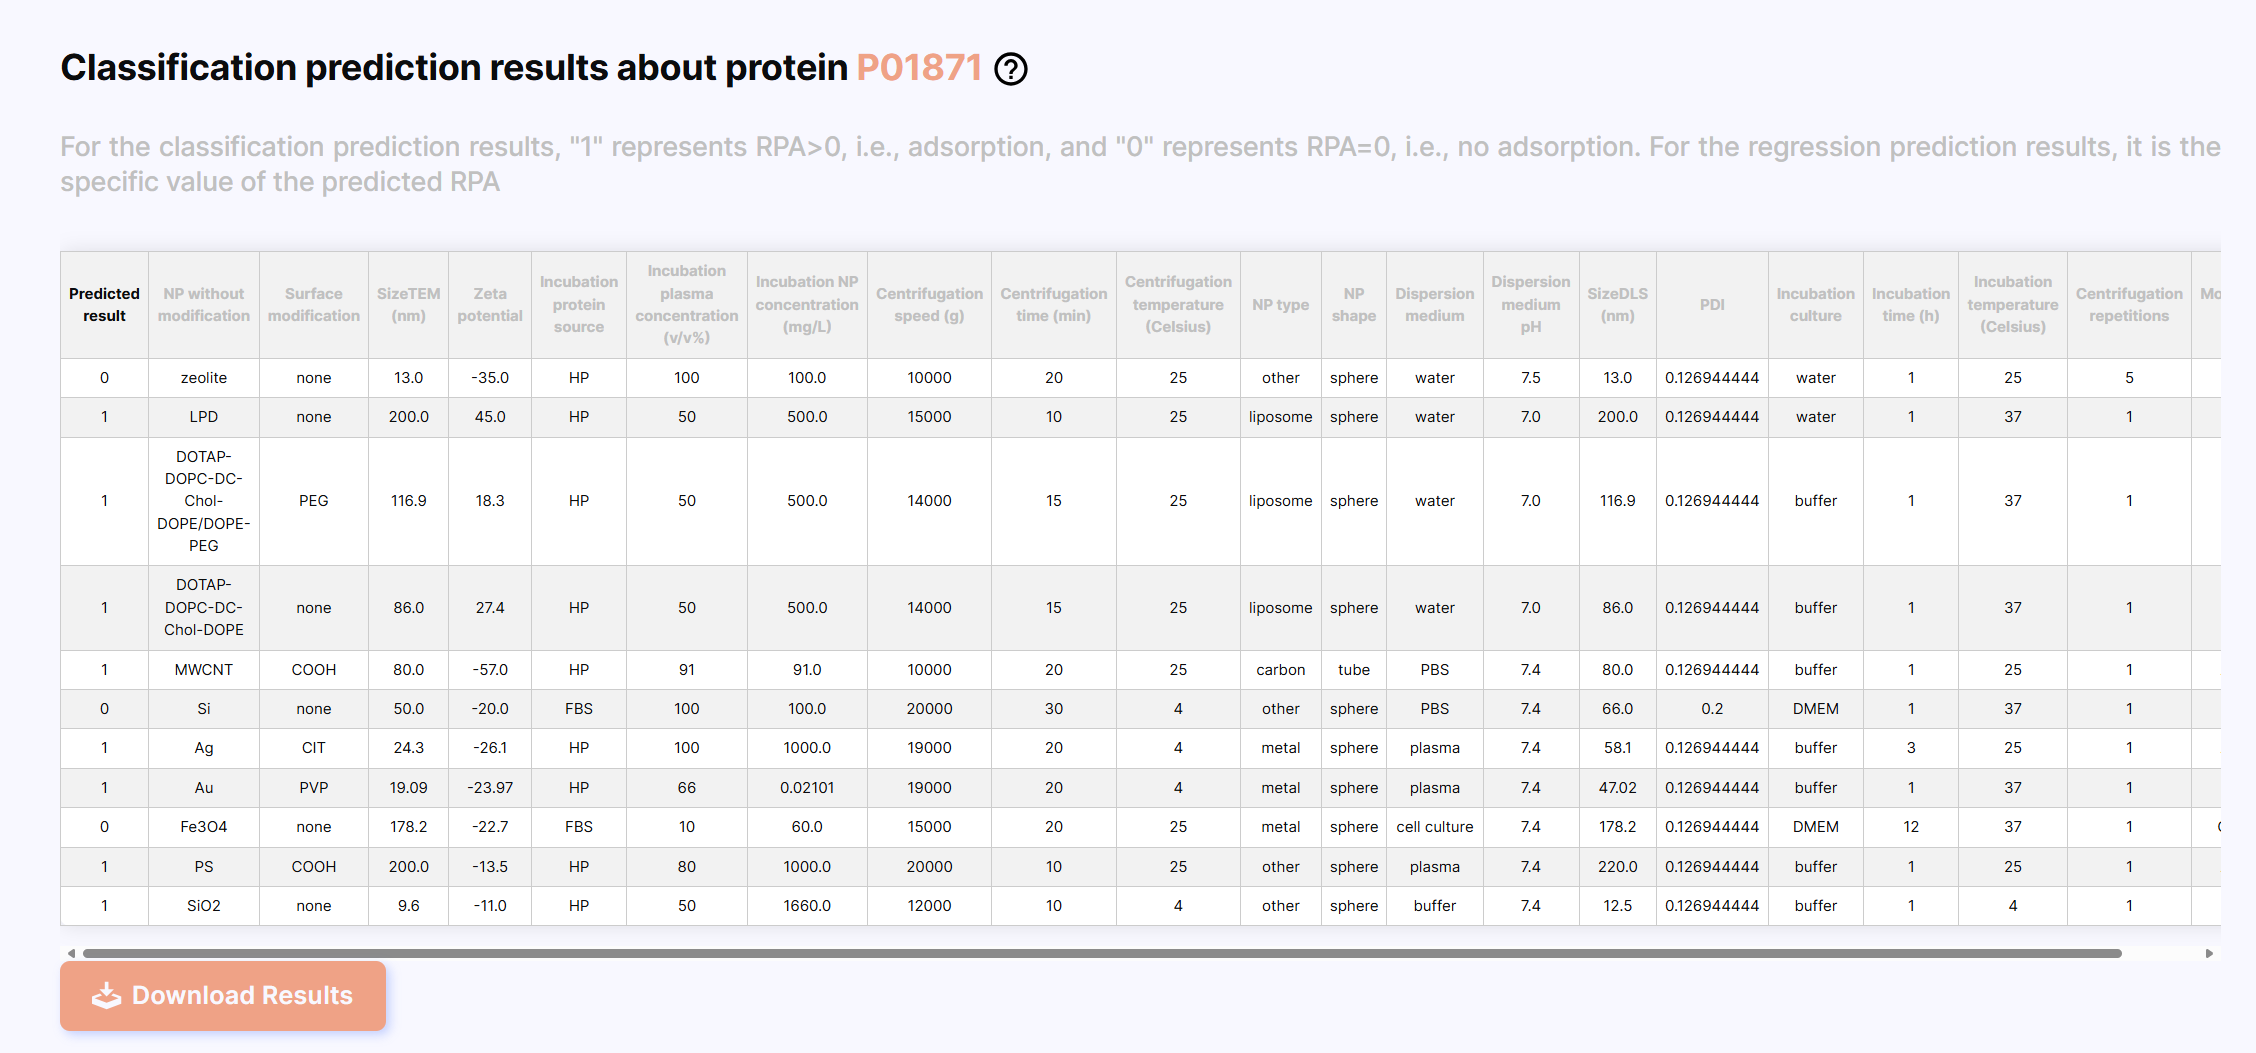
Results
After the prediction is completed, the results are displayed, the first column is the prediction result, which is displayed as 0 or 1 for classification prediction, and as the specific value of RPA (%) for regression prediction. You can click the “Download Results” button to download the results.
Classification results
Regression results